
Qwen API: 22 of 27 Models Carry Vision — What a Near-Uniform Flag Buys You
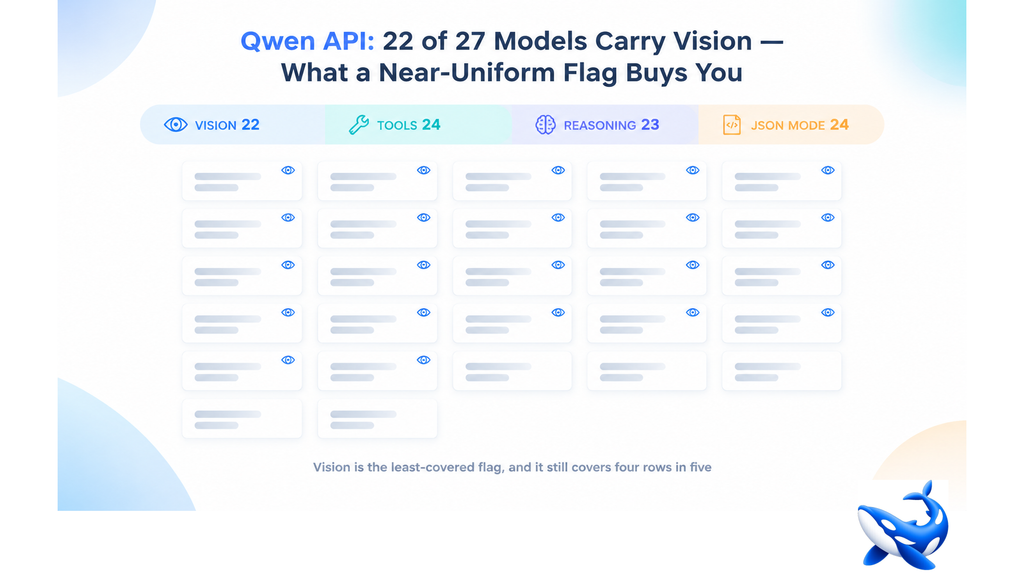
The OrcaRouter Qwen API page lists 27 models, and 22 of them carry the vision flag — while 24 carry tool calling, 23 carry reasoning and 24 carry JSON mode. Four capability counts on one page, and the narrowest of the four is the one most buyers treat as the special case. That inversion is worth reading slowly, because a flag that covers four rows in five is not a feature you go shopping for. It is a default you plan around.
Every capability flag answers a build question. Tools decide whether a model can call your functions. Reasoning decides whether it can spend tokens on a problem before answering. JSON mode decides whether the output parses without a repair pass. Vision decides whether an image can enter the request at all — and that last question used to be answered by one or two flagship rows per vendor, priced like a privilege. On this page it is answered by 22 rows out of 27, spread from near the bottom of the price ladder to the top of it, which changes what the flag is worth to you.
The census, read as four counts
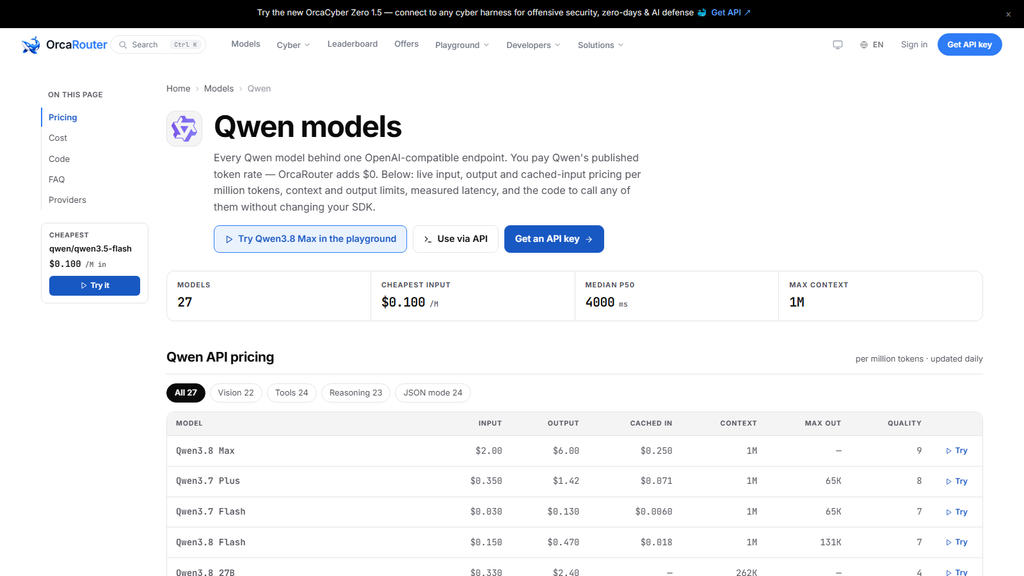
The page header carries four statistics of its own: 27 models, a cheapest input rate of $0.100 per million tokens, a median p50 of 4000 ms, and a maximum context of 1M. The capability census below it is where the interesting arithmetic lives: vision 22, tool calling 24, reasoning 23, JSON mode 24.
Subtract each count from the 27 rows and the shape of the catalogue falls out. Vision is the least-covered of the four flags — five rows sit outside it — and it still covers four rows in five. Tool calling and JSON mode are three rows wider, and reasoning sits between them at four rows outside. The ordering runs against the habit most teams bring to a model catalogue, where capabilities are imagined as a stack of premium tiers: a base text row, a tool-calling row above it, a reasoning row above that, and vision somewhere at the top of the price column. Here the flags are not stacked that way. Vision is closer in coverage to tool calling than either of them is to the page’s price ceiling.
One caveat belongs in the same breath as those numbers. The census counts flags, not rows: the page does not print a per-row capability column, so the five rows that sit outside the vision count are not labelled for you. What the flag counts tell you is the shape of the catalogue, and the shape is that multimodal input is nearly uniform here.
Where the vision rows sit on the price ladder
Four rows put VL in the name, and they are the useful anchor because they advertise the capability rather than merely carrying it.
| Model | Input / output per 1M | Context | Quality |
| Qwen3 VL 8B Instruct | $0.180 / $0.700 | 131K | 4 |
| Qwen3 VL 8B Thinking | $0.180 / $2.10 | 131K | 4 |
| Qwen3 VL 235B A22B Thinking | $0.400 / $4.00 | 131K | 6 |
| Qwen3 VL 235B A22B Instruct | $0.400 / $1.60 | — | — |
The quality column in that table is our own 0-to-10 composite — our measurement of each model across the dimensions we grade, not a third-party benchmark — and every time the number appears in this article it carries the same label. The last row’s context and quality cells are empty on the page itself, and we are not filling them in.
Those four rows span $0.180 to $0.400 per million input tokens. The page’s floor is $0.030 per million on Qwen3.7 Flash. Its ceiling is $2.00 on Qwen3.8 Max and on the 0902 variant of the same model. So the rows that advertise vision sit in the middle of the ladder: the cheapest of them is six times the floor, and the dearest is a fifth of the ceiling. None of the five cheapest rungs — $0.030, $0.057, $0.086, $0.100 and $0.115 — carries a VL name, which is not the same as saying those rows lack the flag. With 22 of 27 rows carrying it, vision plainly reaches rows that never put it in a product name.
How the other six provider pages compare
The Qwen page is not the only place on the site where vision is routine, and that is the point. Lined up against the six other provider pages, the vision counts read like this:
| Provider page | Models | Vision rows |
| OpenAI | 76 | 59 |
| Qwen | 27 | 22 |
| Anthropic | 13 | 13 |
| Grok | 5 | 5 |
| Kimi | 4 | 4 |
| Z.ai | 10 | 2 |
| DeepSeek | 9 | 2 |
Five of the seven pages treat vision as ordinary; two treat it as scarce. Qwen’s 22 rows is the largest vision count outside the 76-row OpenAI catalogue, and its four-in-five density is the highest of any broad catalogue in the set — the three pages that beat it on percentage are small ones, at 13, 5 and 4 rows. If you arrived expecting multimodal input to be a premium tier, two pages on this site will confirm the expectation and five will contradict it.
What a near-uniform flag buys you
Three things, all structural rather than cosmetic.
The first is fallback. A pipeline that accepts images needs a second row that also accepts images. When a flag covers 22 of 27 rows, the fallback pool is a pool rather than a pair. A retry that lands on a text-only row is not a retry — it is a silent downgrade, and it surfaces as a thin answer rather than an error, which is the worst way for a failure to arrive.
The second is filtering. The page’s own guidance is to use the capability chips above the pricing table to narrow the list to the models that support what you need. On a page where vision reaches 22 of 27 rows, that filter removes five rows. On a page where it reaches 2 of 9, the same filter removes seven and leaves you choosing between two.
The third is price. A wide vision set is big enough to hold its own ladder, and this one does: $0.030 at the bottom of the input column and $2.00 at the top is a 67-fold spread inside the rows that can see. Every one of those rates is the provider’s published rate with $0 markup from the gateway, so the comparison you are running is between Qwen’s own prices rather than between a list price and a marked-up one.
Vision is not the same as quality
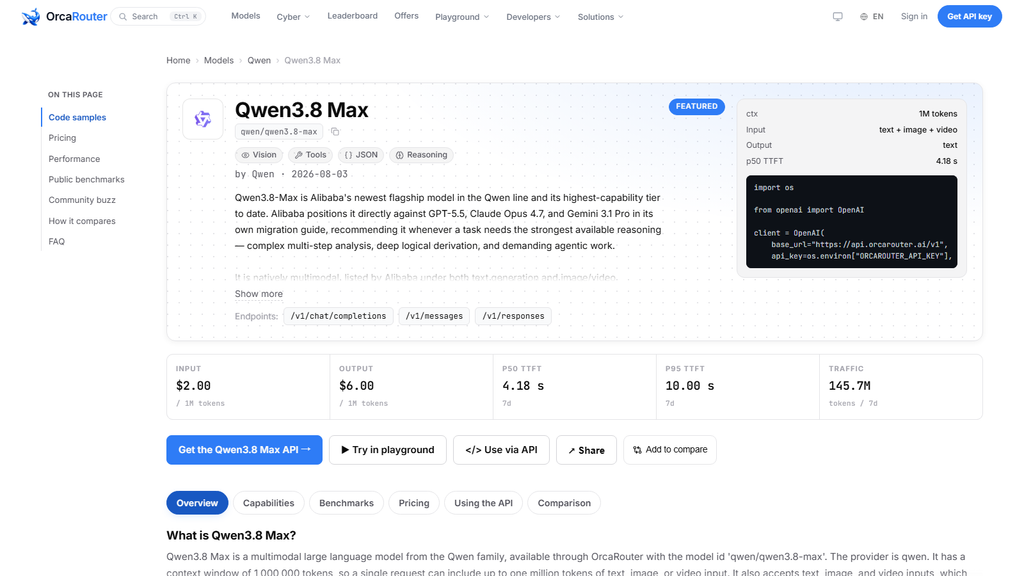
The flag tells you an image can enter the request. It does not tell you the row is good, and on this page the two diverge in a way worth naming. The two Qwen3 VL 8B rows score 4 on our composite — the 0-to-10 score we build ourselves, not a third-party benchmark. The 235B Thinking row scores 6. The highest quality scores on the page, 9, belong to Qwen3.8 Max and Qwen3.8 Max (0902), neither of which puts VL in its name.
The window column diverges too. The 131K context on the VL rows is generous by the standards of vision-capable rows elsewhere, but it is roughly a seventh of the 1M that several non-VL rows on the same page carry, and four rows priced under $0.200 on this page stop at 32K entirely. A catalogue where vision is nearly universal does not flatten the rest of the table. It just means that when a row fails you, the cause is more likely to be window, quality or rate than the ability to read a screenshot.
What to do with 22 out of 27
Treat the flag as settled and shop on the columns that still differ. Decide whether your workload needs 32K, 131K or 1M, because those three tiers are what actually split the 22 rows into usable groups. Then sort by input and output price inside the tier you need, remembering that the $0.030 row and the $2.00 row both carry the flag. Then check the quality composite, and read it for what it is — our own 0-to-10 measure of each model, stated as ours every time it appears.
The takeaway
Twenty-two of 27 is not a headline feature; it is the absence of a constraint. The useful reading of this page is not that Qwen has a lot of multimodal models, but that on this catalogue multimodal is the default, tool calling is nearly as wide, and the differentiators you are left choosing between are window size, rate and our own quality composite. A capability that every row has stops being a line item on a comparison. On this page, that is exactly what vision has become.
Sourcing note: all model counts, capability census figures (vision 22, tools 24, reasoning 23, JSON mode 24), prices, context windows and the header statistics for the Qwen page are read from the OrcaRouter Qwen provider page and the linked model page on 2026-10-14, and are the providers’ published rates with $0 markup. The quality figures are our own 0-to-10 composite — our measurement of each model, not a third-party benchmark. Cross-provider vision counts come from the equivalent OrcaRouter provider pages, read the same day. Prices and telemetry are live values and will drift. All checked 2026-10-14.